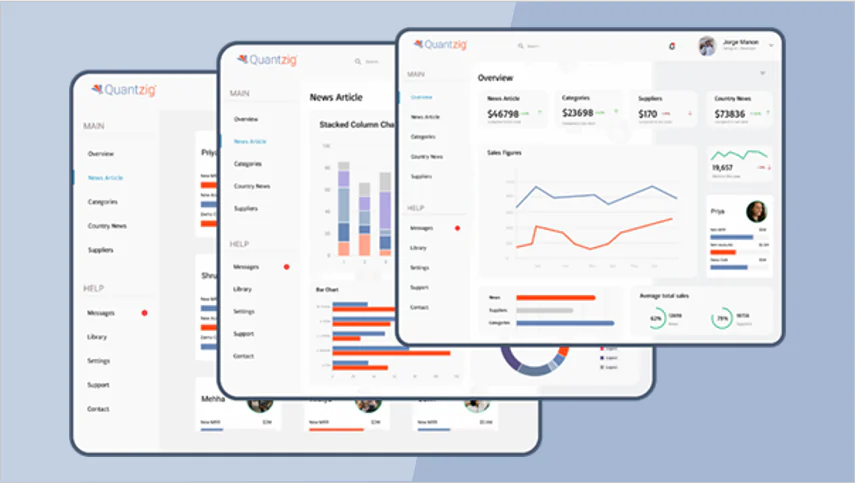
Organizations today face an unprecedented challenge: making sense of vast amounts of data generated daily. The solution lies in data visualization consulting services, which transform complex datasets into clear, actionable visuals. From crafting compelling data stories to enabling data-driven decision-making, these services play a pivotal role in unlocking the potential of data for businesses.
This blog explores how data visualization, coupled with expert consulting, is revolutionizing industries, enhancing business intelligence, and helping organizations leverage insights for better outcomes.
Book a demo to experience the meaningful insights we derive from data through our analytical tools and platform capabilities. Schedule a demo today!
Request a Free DemoTable of Contents
The Importance of Data Visualization in Modern Business
1. Transforming Raw Data into Actionable Insights
At the heart of data visualization lies the ability to translate raw, unstructured data into graphical formats such as charts, graphs, and interactive dashboards. This enables businesses to identify patterns, trends, and anomalies more effectively.
For example:
- A line graph can showcase revenue trends over months.
- A heatmap can reveal performance disparities across regions.
2. Driving Data-Driven Decision-Making
Data-driven decision-making is a cornerstone of modern business intelligence. When leaders have access to well-structured visuals, they can make informed decisions faster, whether it’s optimizing marketing strategies, streamlining operations, or forecasting sales.
3. Enhancing Collaboration with Visual Storytelling
Data becomes more impactful when shared effectively. Data storytelling combines visuals with narratives, making complex information accessible to diverse teams, from executives to operations managers.
Key Benefits of Data Visualization Consulting Services
Partnering with data visualization consulting services brings expertise and advanced tools to the table. Here’s why organizations should consider these services:
1. Tailored Visualization Solutions
Consultants design bespoke data visualization solutions that align with an organization’s goals. For instance, a retailer may need dashboards to monitor inventory, while a financial firm may require tools for predictive analytics.
2. Access to Advanced Tools
Experts in data analytics consulting leverage state-of-the-art tools such as:
- Tableau: For creating dynamic, interactive dashboards.
- Power BI: For integrating data visualization with business intelligence.
- D3.js: For highly customized, web-based visualizations.
3. Improved Business Intelligence
Visualization consultants enhance an organization’s business intelligence capabilities by integrating data from multiple sources into unified dashboards. This enables decision-makers to view the big picture and drill down into specifics.
4. Actionable Reporting Services
Data reporting services transform raw data into concise, visually rich reports. These reports empower stakeholders to act on insights without wading through complex datasets.
5. Training and Ongoing Support
Consultants often provide training to internal teams, ensuring they can manage and update their data visualization tools independently, maximizing ROI.
Building a Data Visualization Strategy
Creating an effective strategy for leveraging data visualization requires more than just adopting tools. Here’s how businesses can succeed:
1. Define Objectives
Clearly outline what you aim to achieve, such as better resource allocation, enhanced operational efficiency, or deeper customer insights.
2. Identify Key Metrics
Focus on metrics that align with organizational goals. Avoid overwhelming dashboards with excessive data points.
3. Choose the Right Tools
Evaluate tools based on their functionality and compatibility with your data ecosystem:
- Power BI: Ideal for Microsoft-integrated workflows.
- Tableau: Excellent for detailed, interactive dashboards.
- D3.js: Perfect for custom web-based visuals.
4. Ensure Data Accuracy
Work with consultants to clean and organize data, ensuring that visualizations are based on reliable inputs.
5. Iterative Testing
Gather feedback on dashboards and reports, refining them to meet user needs and enhance usability.
How Quantzig Revolutionizes Data Visualization for Businesses
Quantzig is at the forefront of offering comprehensive data visualization consulting services that empower organizations to make better decisions. With a focus on delivering tailored solutions, Quantzig ensures that businesses extract maximum value from their data.
Why Partner with Quantzig?
- Customized Visualization Solutions:
Quantzig crafts unique data visualization solutions tailored to industry-specific challenges, ensuring actionable insights. - Tool Expertise:
Our experts are proficient in leading data visualization tools like Tableau, Power BI, and QlikView, delivering advanced analytics. - Seamless Data Integration:
Quantzig integrates data from multiple sources into unified dashboards, enabling real-time decision-making. - Interactive Dashboards:
We design intuitive dashboards that make data analysis accessible to all stakeholders. - Data-Driven Decision Making:
Quantzig emphasizes data storytelling to help clients align strategies with insights.
Experience the advantages firsthand by testing a customized complimentary pilot designed to address your specific requirements. Pilot studies are non-committal in nature.
Request a free pilotThe Future of Data Visualization: Emerging Trends to Watch
As technology continues to evolve, the field of data visualization is undergoing a radical transformation. With the advent of new tools, technologies, and methodologies, businesses can now harness more sophisticated ways of presenting and analyzing data. Let’s explore some of the most exciting trends shaping the future of data visualization:
1. AI-Driven Visualizations
Artificial intelligence (AI) is revolutionizing data visualization by automating the creation of visuals and enhancing the way businesses analyze and interpret data. AI-driven visualizations are poised to make data analysis more accessible, faster, and more insightful. Here’s how:
- Automated Insights: AI can automatically generate data visualizations based on large datasets, reducing the time spent manually designing graphs and charts. It can identify patterns, trends, and anomalies in the data and highlight them through visual formats like charts, heatmaps, and graphs. This capability significantly reduces the workload for data analysts, enabling faster decision-making.
- Predictive Analytics: AI-powered predictive analytics can enhance visualizations by providing future projections based on historical data. For example, AI can help businesses visualize potential future sales trends or customer behaviors, empowering them to make data-driven decisions with foresight.
- Natural Language Processing (NLP): AI is also enabling data storytelling through Natural Language Generation (NLG). By using AI to interpret complex data and automatically create textual narratives alongside visualizations, businesses can make insights easier to understand, even for non-technical stakeholders.
- Anomaly Detection: AI is adept at flagging outliers or unusual patterns in data, which can then be automatically displayed in visual forms such as red-flag charts or visual markers, ensuring that important anomalies are never missed.
AI-driven visualizations make it possible for organizations to process larger datasets, reveal hidden patterns, and make timely decisions without relying on traditional, labor-intensive methods of analysis.
2. Immersive Experiences with Virtual and Augmented Reality (VR/AR)
Virtual reality (VR) and augmented reality (AR) are transforming interactive dashboards and the way businesses present and interpret data. These immersive technologies are taking data visualization to new heights by enabling businesses to interact with data in three-dimensional spaces.
Here’s how VR and AR are changing the landscape of data visualization:
- 3D Visualizations: Traditional 2D charts and graphs are limited in their ability to display multidimensional data effectively. 3D visualizations provide users with the ability to explore data from different angles and dimensions, offering a more comprehensive and interactive view of the data. For example, a 3D scatter plot could allow users to view clusters of data points in space, providing insights into correlations or patterns that might be less evident in a traditional 2D chart.
- Immersive Dashboards: With virtual reality (VR), users can interact with data visualization tools in a fully immersive environment. VR can be used to visualize complex data such as financial models or supply chain operations, allowing decision-makers to “walk through” the data and understand it from multiple perspectives.
- Data Interaction: Augmented reality (AR) enhances the real-world experience by superimposing digital data visualizations over physical objects. For example, an engineer could use AR to visualize sensor data overlaid on a machine, or a salesperson could see product trends projected on a retail display. This makes data analysis more intuitive and actionable, as it can be contextualized with real-world environments.
- Virtual Collaboration: VR and AR can also enable virtual collaboration between teams, allowing decision-makers from different locations to interact with data visualizations in real time. By sharing a 3D space, teams can engage with data together, even if they are geographically dispersed.
These immersive technologies will continue to break down barriers and redefine how we interpret and interact with data, creating more dynamic and engaging experiences for business users.
3. Real-Time Analytics and Visualization
With the exponential growth of the Internet of Things (IoT) and advancements in computing power, real-time analytics and data visualization are rapidly gaining prominence. Businesses now have access to real-time insights, which are displayed through dynamic interactive dashboards that update continuously as new data streams in. This capability is a game-changer in several key ways:
- Instant Decision-Making: Real-time analytics allows businesses to make decisions immediately based on up-to-the-minute data. For example, an e-commerce platform can track user behavior in real time and adjust its marketing strategies or product recommendations instantly based on user activity. This enhances agility and responsiveness, especially in industries where market conditions change rapidly.
- Operational Efficiency: Real-time dashboards are vital for industries like manufacturing and logistics, where continuous monitoring of operations is crucial. With live tracking, managers can monitor production lines, inventory, and employee performance in real time, quickly identifying bottlenecks or areas for improvement.
- Customer Interaction: With real-time data, companies can respond to customer inquiries or issues immediately, offering better service and improving customer experience. For example, customer service teams can access live chat analytics, social media sentiment, and call center data to provide timely and accurate responses.
- IoT Integration: The proliferation of IoT devices has enabled the collection of data in real time from sensors, machines, and wearables. By integrating this data into data visualization solutions, organizations can continuously monitor operational metrics such as equipment performance, environmental factors, and supply chain conditions. These visualizations can then be used to predict failures, minimize downtime, and optimize maintenance schedules.
- Data Streams and Alerts: As data is continuously streamed, real-time dashboards can trigger instant alerts whenever specific thresholds are crossed. For example, a financial institution might receive a notification when market volatility exceeds a set limit, prompting immediate action. Similarly, a healthcare provider could receive real-time alerts on patient vitals, enabling prompt medical intervention.
Real-time analytics, combined with data visualization tools, empowers organizations to make proactive decisions, improving responsiveness and creating a competitive edge.
Conclusion
As technology continues to evolve, data visualization is becoming more sophisticated, powerful, and integral to business decision-making. From AI-driven visualizations that automate and predict insights to immersive VR/AR experiences that bring data to life, the future promises more engaging and dynamic ways of interacting with information. Furthermore, real-time analytics is enabling businesses to respond to changes as they happen, ensuring that companies remain agile and competitive in fast-paced environments.
As businesses look to stay ahead of the curve, leveraging these emerging trends will be crucial. Whether you’re improving internal processes, enhancing customer experiences, or making strategic business decisions, these advanced data visualization trends are unlocking new possibilities for growth and success.
Adopting these cutting-edge visualization techniques will not only allow businesses to understand their data more deeply but will also help them turn insights into action faster, making data a true driver of business success in the years ahead.
Get started with your complimentary trial today and delve into our platform without any obligations. Explore our wide range of customized, consumption driven analytical solutions services built across the analytical maturity levels.
Start your free trial


