Table of Contents
Introduction
In today’s Competitive Landscape, a data-driven approach to decision-making is necessary to keep ahead in the highly competitive corporate environment of today. Key Performance Indicators (KPIs) provide essential insights into performance, the effectiveness of strategies, and areas of need for improvement. They are responsible for directing organizations to their goals. The true strength of KPIs is not only in their measurement, but also in the way that they are reported and used to provide valuable business insights.
This article focuses on the dynamic world of KPI reporting and insights, and the best practices that make successful organizations apart from the competition. We examine every aspect of this crucial process, from choosing the appropriate KPIs that meet corporate objectives to utilizing data visualization, from setting reasonable targets to releasing analytics’ predictive power. By utilizing these best practices, businesses can transform unactionable data into intelligence that can be utilized, creating a culture of informed decision-making that drives them to success and growth. Come along as we explore the key elements of effective KPI reporting and how to use insights to your advantage.
Importance of best practices of business KPI reporting & insights
- Actionability as Priority – Every KPI monitoring solution should focus on actionability. Analytics data is not only available to be archived; it is necessary to drive efficient and informed solutions.
- Dashboard Design Principles – Design concepts for dashboards must be taken into consideration when building them. They transform dashboards into instruments that turn complicated data into useful insights.
- Real-time Decision Making – The best dashboards enable users to observe performance trends in real-time and make quick, actionable decisions.This encourages a culture of speed and agility, which in today’s fast-paced business environment promotes long-term growth and competitiveness.
Challenges of best practices of Business KPI reporting insights
- One of the biggest challenges businesses face is the transition from Traditional , user-centric dashboards to modern dashboard solutions. Not only does this necessitate tech upgrades, but it also necessitates cultural and process modifications. It is a major issue for businesses to maintain continuity with user adoption.
- It is essential to collaborate with business organizations on KPI reporting. The combination of technical expertise and business experience and user-centered design principles is a delicate balance. The pursuit of active business team participation for relevant, useful dashboards is a constant challenge.
Benefits of best practices of Business KPI reporting & insights

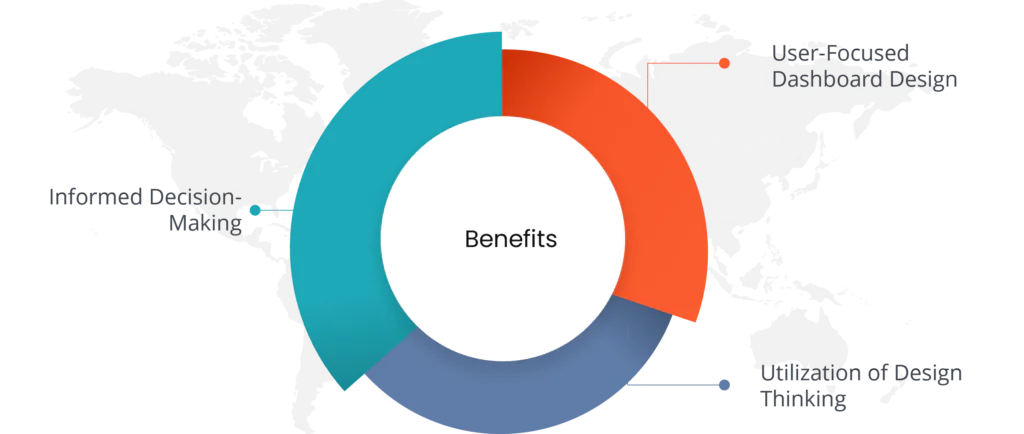
- Informed Decision-Making – Organizations can utilize the best practices in KPI reporting and insights by highlighting the importance of data-driven decision-making in the competitive business environment of today. This makes it possible to transform raw data into useful intelligence, supporting informed and well-planned decision-making.
- User-Focused Dashboard Design – It is essential to design dashboards with the end-user in mind. By engaging with users to understand their needs, defining specific objectives, and brainstorming creative solutions, companies can create dashboards that not only provide valuable information but also provide a intuitive and user-friendly experience.
- Utilization of Design Thinking – Using methods such as prototyping, testing, and wireframes, organizations can benefit from the use of design thinking ideas in dashboard creation. These procedures ensure that dashboards are inventive and adapted to particular user needs, while being user-friendly, thereby enhancing usability and the impact of data reporting systems.
Success Story
Client Details: A leading Company located in France.
Challenges faced by the Client:
Our client faced a significant challenge to transition from warehouse based dashboards to modern, user-friendly, and 3-Click dashboards. There were two major obstacles to overcome.
- Technical Overhaul – A significant technological transformation of their current data infrastructure and visualization technologies was necessary to implement the move. It required a thorough evaluation and redesign to ensure data continuity and a smooth transition without interfering with regular business activities.
- Cultural Adaptation – Additionally to the technical challenges, our client also faced the challenge of creating a cultural change within their organization. The adoption of 3-Click dashboards required a mindset shift, as employees were already employed in traditional data reporting techniques. The adoption of modern dashboards, which focus on ease of use and agility, was crucial to unlock the full power of data driven decision-making.
Another challenge our client faced was to find a strategic partner who could design a collaborative process for creating business dashboards with their business teams. This was because they wanted to transform complex data into easy-to-use solutions that meet their organizational needs. This required more than technical expertise; it required the combination of business knowledge and user-centered design principles. To overcome this challenge, they needed to enable their business teams to actively participate in the dashboard development process.
Solutions Offered by Quantzig
Quantzig provide a unique approach that focuses on creating KPI-driven dashboards by implementing design thinking processes. Design thinking is the process of transforming data into actionable insights, instead of just data presentation. By incorporating design thinking principles into our dashboard development process, end-users are the driving force behind our design strategy. We focused on empathy, ideas, and iteration to customize each dashboard to our clients’ needs and preferences. The result is a collection of dashboards that provide valuable KPIs but do so in an easy-to-understand, visually appealing way, enabling our clients to make informed decisions with confidence and effectiveness.
- Empathize with User – We strive to create a user-friendly experience. We engage with dashboard users through conversation and active listening. We listen to their pain points, goals, and technical expertise to get a better understanding of what they need, so we can design the dashboard to provide the correct information in an easy-to-understand way. Our approach is user-centric, which leads to a better, more personalized dashboard.
- Define the Problem – Identifying the user’s needs is the key component of our solution architecture. By engaging with users on a regular basis, we gain insights that enable us to define exactly what our dashboard is intended to accomplish. This definition is based on their specific goals, pain points and desired outcomes. This does not only help us focus our design efforts, but also aligns them with the real issues our users are facing. This allows us to provide a custom dashboard solution that responds directly to their specific needs.
- Ideate Solutions – We emphasize brainstorming as an essential component of our process to solve user-defined issues. Collaborative brainstorming allows us to explore a variety of creative solutions to meet the specific needs of our end users. We consider different types of visualization, innovative layouts, and interactive elements to create dashboards that address not only the identified issues but also provide an enhanced user experience. Due to our focus on thinking outside the box, our dashboard solutions are not only practical but also innovative, pushing the limits of data visualization and delivering meaningful insights in a new way.
- Prototype the Solution – Our approach involves prototyping the dashboard solution. By prototyping, we create a working prototype that reflects the design client is considering. This allows us to conduct user testing efficiently. By doing so, we can identify usability issues and obtain user feedback early in the design. By engaging with users during the testing process, we gain valuable insights that inform improvements and refinement. The client can be sure that the final dashboard will not only meet but exceed user expectations.
- Test the Prototype – Testing the prototype is the most crucial part of the process. We actively listen to our users and encourage them to suggest design enhancements. Our goal is to make the dashboard not only easy to use but also intuitive, ensuring a smooth and accurate user experience for efficient data usage.
Here are a few more ways by which Quantzig use design thinking in dashboarding:
- Use Wireframes – Quantzig wireframes as a key element in our dashboard design process. We understand that visual representations such as charts and graphs help users understand and retain data better. These visual aids make it easier for users to comprehend complex information. By incorporating visual elements into dashboards, not only do we encourage clarity, but we also help users gain insights quickly and easily, resulting in a more engaging user experience.
- Keep it Simple – Quantzig don’t overload dashboard with too many information. We focus on the most important metrics and ensure that the visuals are clear and easy to comprehend.
- Be Consistent – To make the dashboard appear professional and professional, focus on consistency. Use the same colors, fonts, and styles in every element to create a cohesive visual experience. Not only does this make dashboard look more attractive, but it also makes it easier to use and more visually appealing.
- Get Feedback – Don’t hesitate to ask users for feedback. By doing so, you will be able to enhance the dashboard experience and make it easier to use.
Impact Delivered

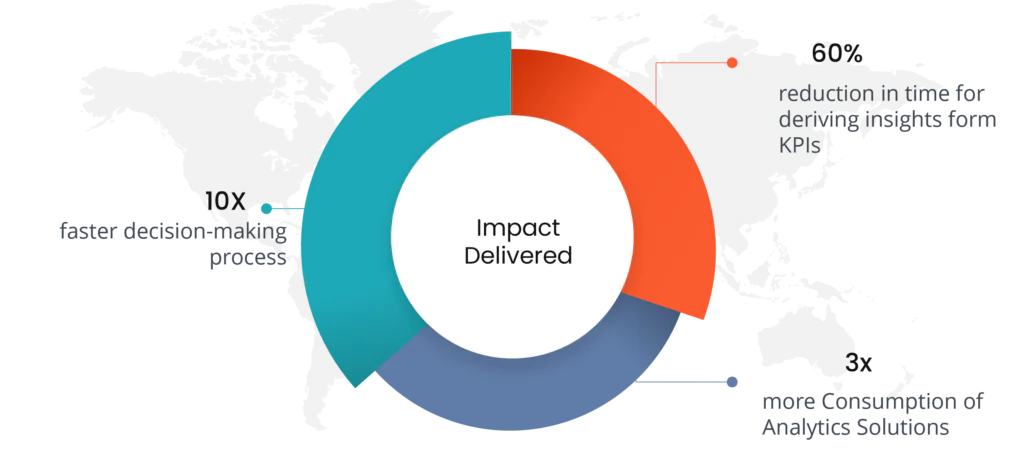
- 10X Faster Decision-Making Process
- 60% reduction in time for deriving insights form KPIs
- 3x more Consumption of Analytics Solutions
Implementations/Techstack Used
- Microsoft Power Platforms
- Power BI
- Power Automate
“Transform Your Business Intelligence: Embrace Excellence with Best Practices in KPI Reporting & Insights. Elevate Your Decision-Making. Optimize Your Performance. Drive Strategic Success. Start Your Data-Driven Journey Now!”


