Written By: Sudeshna Ghosh
Table of Contents
Key Takeaways for Causal Analysis
- Causal analysis provides a framework for identifying and understanding the relationships between different factors influencing outcomes, enabling businesses to pinpoint the drivers of success or challenges.
- By leveraging causal analysis, businesses can make data-driven decisions regarding pricing strategies, marketing campaigns, and other critical aspects of their operations, leading to more effective resource allocation and strategy implementation.
- Causal analysis allows organizations to gain predictive insights into future outcomes based on historical data and causal relationships, enabling proactive decision-making and strategy development.
- Through systematic causal analysis, businesses can continuously refine and optimize their operations, marketing efforts, and overall strategies to adapt to changing market dynamics and consumer behavior, fostering long-term growth and success.
Introduction
In the ever-changing field of data analytics, comprehending the cause-and-effect connections between variables can reveal priceless understandings for data-driven decision-making. Causal analysis, a formidable technique in a data analyst’s set of tools, allows us to disentangle the intricate network of interrelated factors. In this article, we’ll shed light on the world of causal analysis, its practical applications, and the transformative impact it can have on optimizing outcomes.
Book a demo to experience the meaningful insights we derive from data through our analytical tools and platform capabilities. Schedule a demo today!
Request a Free DemoEVOLUTION OF CAUSAL MODEL
When making real-world decisions, we typically rely on conventional machine learning models. These standard predictive models can detect patterns in data and make predictions, but they don’t clarify why those patterns exist or what’s causing them. Simply identifying statistical correlations in data isn’t sufficient; we also need to determine the causal mechanisms at work to make informed choices. To do this, the causal relationships within the data must be uncovered, not just the mathematical relationships. Traditional machine learning approaches are limited in that it only reveals mathematical patterns, while causal learning is necessary to truly understand the forces that drive the trends in the data.
Also Read: Maximizing Marketing Budgets with Campaign ROI Analysis
Get started with your complimentary trial today and delve into our platform without any obligations. Explore our wide range of customized, consumption driven analytical solutions services built across the analytical maturity levels.
Start your Free Trial TodayCAUSAL INFERENCE AND USE CASES

Causal inference is the process of determining that a particular treatment led to the observed result. The basic idea behind causal analysis is to address the root cause rather than just the noticeable effects. A root cause is the underlying reason why something occurs, even if it seems far removed from the original effect observed.
The Causal model assists in responding to the following inquiries.
What is the typical impact of the treatment on the treatment result, and how does it function?
Will the treatment affect the individual unit favorably or unfavorably?
Is there any cause-and-effect relationship between the treatment and the outcome?
What is the impact of the treatment on customers’ profitability, and which treatment is suggested to them for investment in a situation with multiple treatment options?
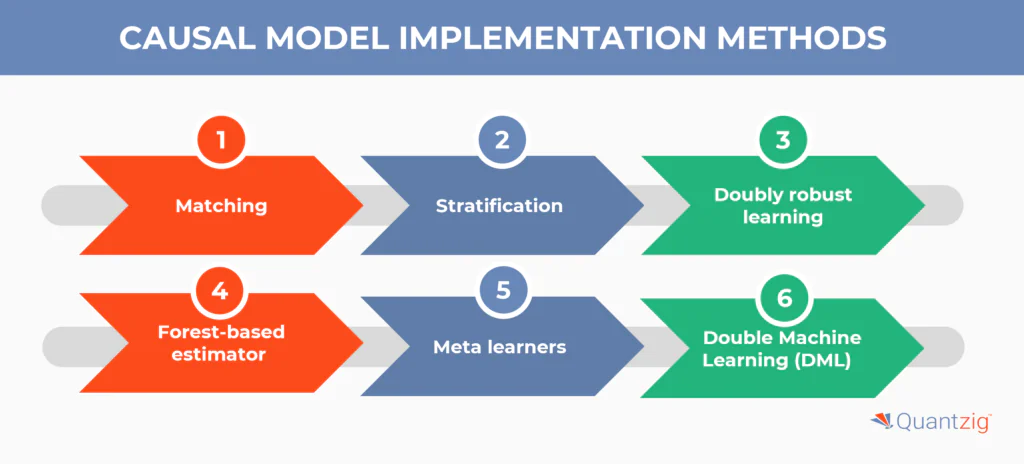
CAUSAL MODEL IMPLEMENTATION METHODS

In this section, we look at techniques for applying causal models to real-world situations. There are various approaches for putting causal models into practice – some utilize fundamental ideas, while others leverage machine learning techniques. Below is an overview of several methods that can assist with constructing a causal model.
1. Matching
The matching method groups parameters with similar propensity score values, which summarize the units’ covariances. Propensity scores indicate similarity between treated and untreated units. Within these matched groups, the treatment differences between treated and untreated units are calculated to find the average treatment effect (ATE), the average treatment effect on the treated (ATT), etc. So matching is analogous to a standard regression approach.
2. Stratification
In this method, the larger group is divided into smaller, more similar groups based on certain characteristics or measurements. The treated group and control group within each of these smaller groups are matched as closely as possible. Then, the effect of the treatment is calculated within each matched subgroup. This technique is primarily used to control for selection bias when assigning participants to treatment or control groups.
3. Doubly robust learning
This method is utilized when the data set contains too many variables for statistical techniques to be effective, or the relationships between variables are not accurately represented by a statistical model. It is advised to employ this method when the variable denoting the treatment condition is categorical, and all potential confounding variables have been measured. Using this technique can help determine treatment effects that differ across subgroups, as it leverages machine learning algorithms to generate baseline predictions. The overall meaning and flow of the original text are maintained while using different wording.
4. Forest-based estimator
This technique can also be applied when the data has an excessive number of attributes. Utilizing a flexible nonlinear method assists in approximating variable treatment effects and confidence intervals.
5. Meta learners

This strategy can be utilized if we have multiple reaction variables.
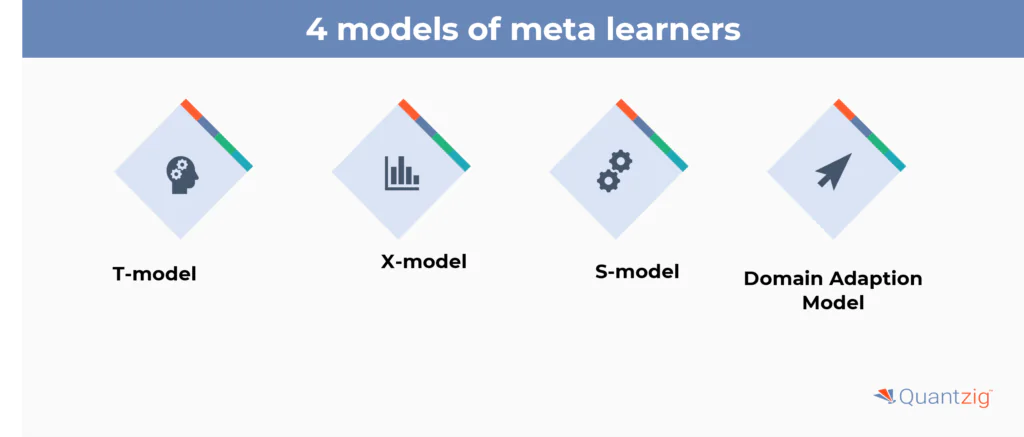
In meta-learners, there are four unique kinds of models:
- T-model: By computing the reaction capacity, the T model assists with evaluating the conditional expectations of the result independently for control and treatment gatherings. The distinction between the two gives the heterogeneous treatment impact of the treatment variable on the result variable.
- S-model: The S-Learner is like the T-Learner, aside from that when we evaluate the result, we utilize all indicators without providing exceptional treatment to treatment variables. The treatment marker is incorporated as a component like every single other component without being given any exceptional job.
- X-model: This technique is utilized when the informational collection contains more control gatherings than treatment gatherings. It primarily utilizes data from the control gathering to evaluate treatment impact. This strategy can likewise handle overfitting issues.
- Domain adaptation model: It employs area adjustment methods to represent covariate movements among treatment arms.
6. Double Machine Learning (DML)
DML is useful for estimating heterogeneous treatment effects and their confidence intervals, quantifying the uncertainty of the model. This method is suggested for classification tasks and those with a single response variable. The primary benefit of DML is that it attempts to correct both regularization bias and overfitting bias through orthogonalization and cross-fitting, respectively. DML has numerous variants like linearDML, sparseDML, causalforestDML, kernelDML, etc. The appropriate variant can be selected based on the dataset type. DML aims to provide accurate estimates of individualized treatment effects and their uncertainty for classification and single-response variable problems. Its main advantages come from its bias correction techniques. It has many specialized versions that can be applied based on the dataset characteristics.
Also Read: Track Business Progress with Marketing Analytics Dashboard
Experience the advantages firsthand by testing a customized complimentary pilot designed to address your specific requirements. Pilot studies are non-committal in nature.
Request a Free PilotWhat are the Methods of Causal Analysis?

To perform successful causal analysis, data analysts use a methodical process. Initially, they characterize the issue and pinpoint the applicable factors. Subsequently, they collect information via questionnaires, trials, or current data sets. By utilizing data exploration techniques like descriptive statistics and visualization, trends and connections emerge. Statistical methods such as regression analysis are then used to determine causation. It’s vital to think about alternative clarifications and complicating elements to guarantee the recognized causal links are strong.
Applications in Business Decisions
Causal analysis examines the variables that affect particular results, enabling analysts to move past basic correlations. For instance, think about a retail company seeking to increase revenue and analyze consumer behaviors. By reviewing historical sales numbers together with factors like marketing efforts, retail price approaches, and seasonal patterns, causal analysis can identify which elements meaningfully influence sales outcomes. With these insights, the retailer can purposefully assign resources, refine marketing plans, and optimize pricing tactics to spur sales growth.
Causal analysis enables organizations to make decisions based on data that produce concrete outcomes. For example, in healthcare, comprehending the causal links between patient results and treatment plans can lead to advancements in care provision. By examining patient information, medical experts can pinpoint which treatments work best for certain illnesses, eventually bettering patient results and decreasing healthcare expenses.
Beyond Predictive Analytics
Though predictive analytics assists in forecasting future patterns, causal analysis digs deeper by revealing the fundamental drivers and rationales behind observed results. By pinpointing causal elements, organizations can take preemptive action to steer preferred outcomes. Whether streamlining supply chains, enriching customer journeys, or minimizing product flaws, causal analysis furnishes the revelations essential to take proactive steps and optimize positive results.
Conclusion
In conclusion, causal analysis serves as a cornerstone in comprehensively understanding the intricate dynamics of consumer behavior, business operations, and market trends. By employing traditional machine learning approaches and advanced data analytics techniques, businesses can uncover cause-and-effect relationships embedded within their historical sales data and marketing campaigns. Through the construction of causal models and rigorous causal inference, organizations can make informed decision-making regarding pricing strategies, promotional emails, and other critical aspects of their operations.
A systematic approach to data exploration techniques allows for the identification of relevant variables influencing revenue growth, consumer behaviors, and retail prices, while also shedding light on seasonal trends impacting market dynamics. Ultimately, embracing causal analysis empowers a retail company to optimize their strategies, enhance consumer experiences, and drive sustainable success in the ever-evolving marketplace.


